Local Kansas City Housing Stats:
Additional Kansas City Stats:
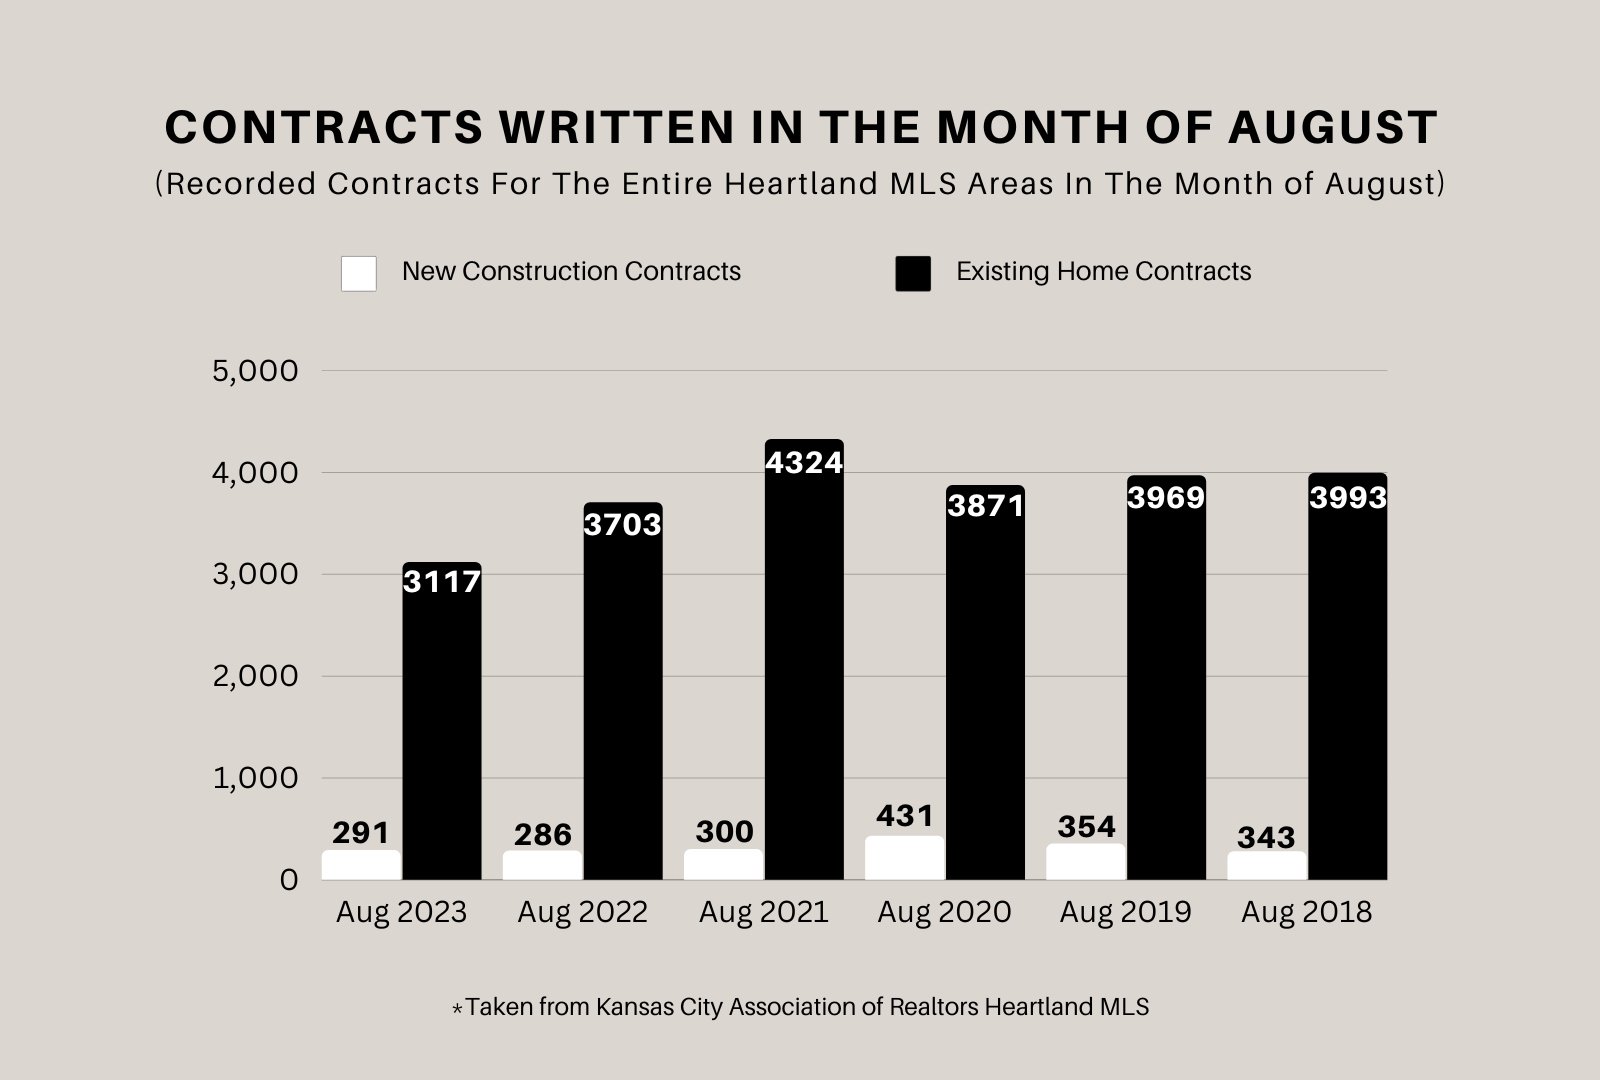
THIS GRAPH REPRESENTS THE NUMBER OF WRITTEN CONTRACTS IN THE MONTH OF AUGUST FOR THE LAST SIX YEARS.
NEW CONSTRUCTION INVENTORY CURRENTLY REPRESENTS OVER 30% OF THE AVAILABLE HOMES IN THE KANSAS CITY HEARTLAND MLS.
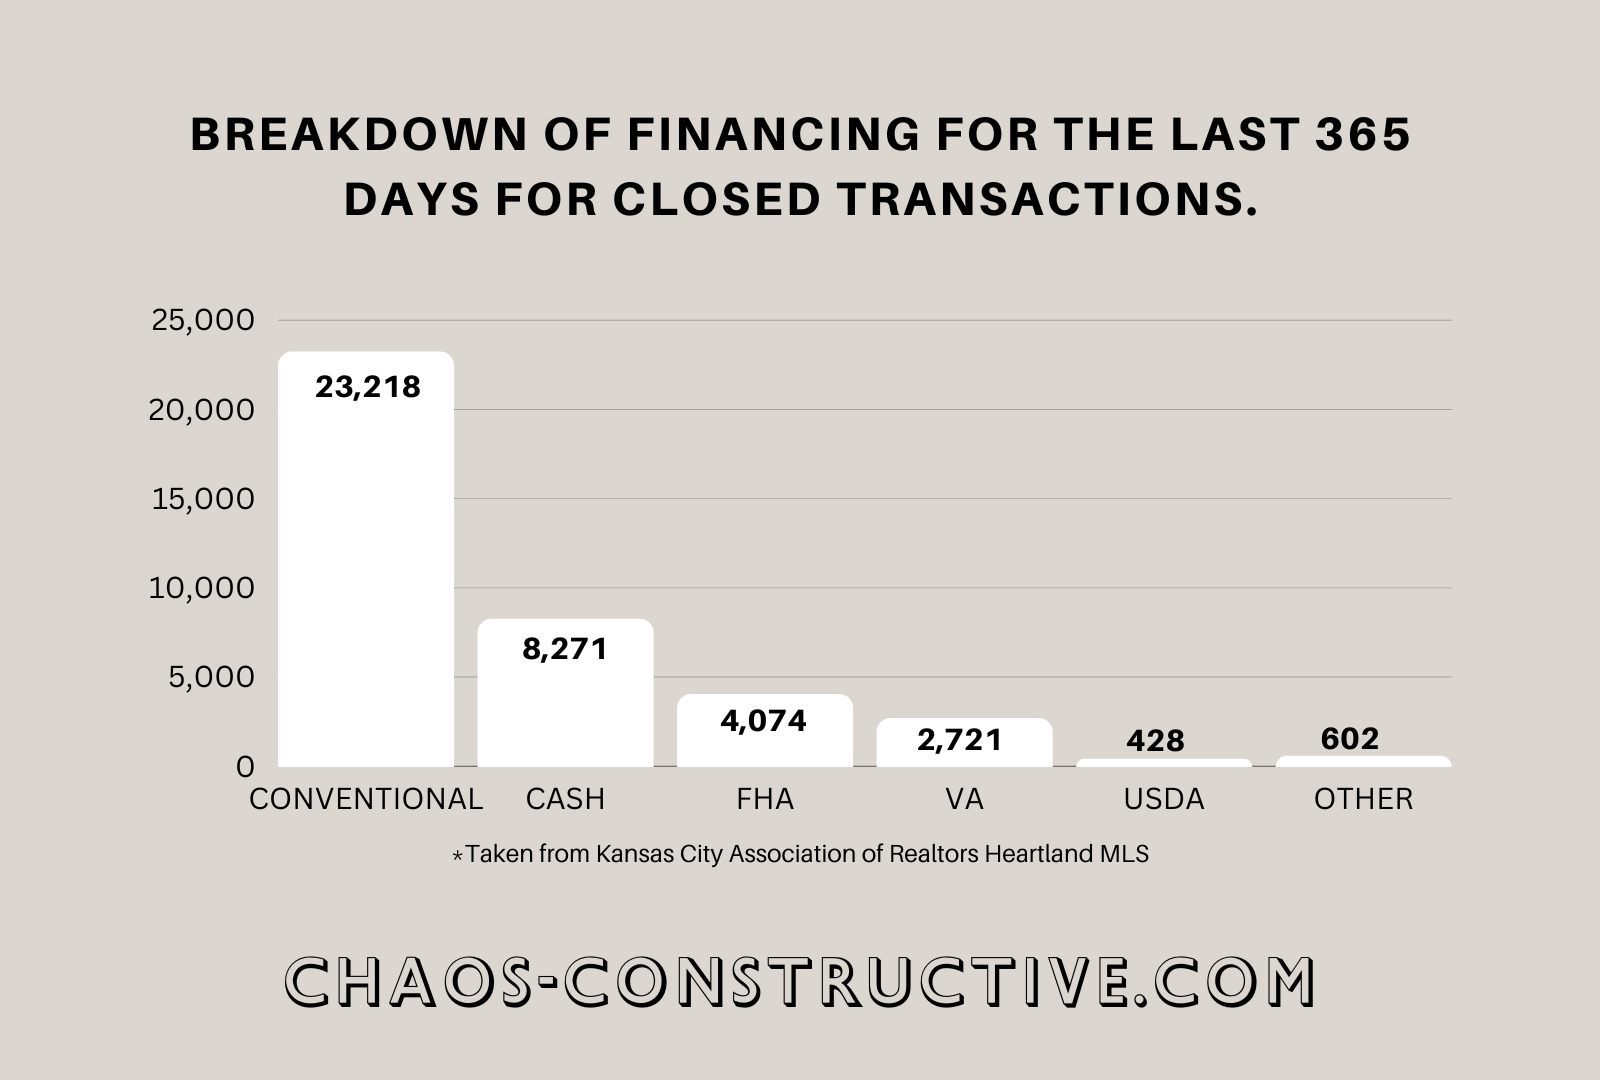
THIS GRAPH REPRESENTS THE BREAKDOWN OF CLOSED UNITS FOR THE LAST 365 DAYS ACCORDING TO WHAT IS REPORTED BY THE KANSAS CITY REAL ESTATE INDUSTRY
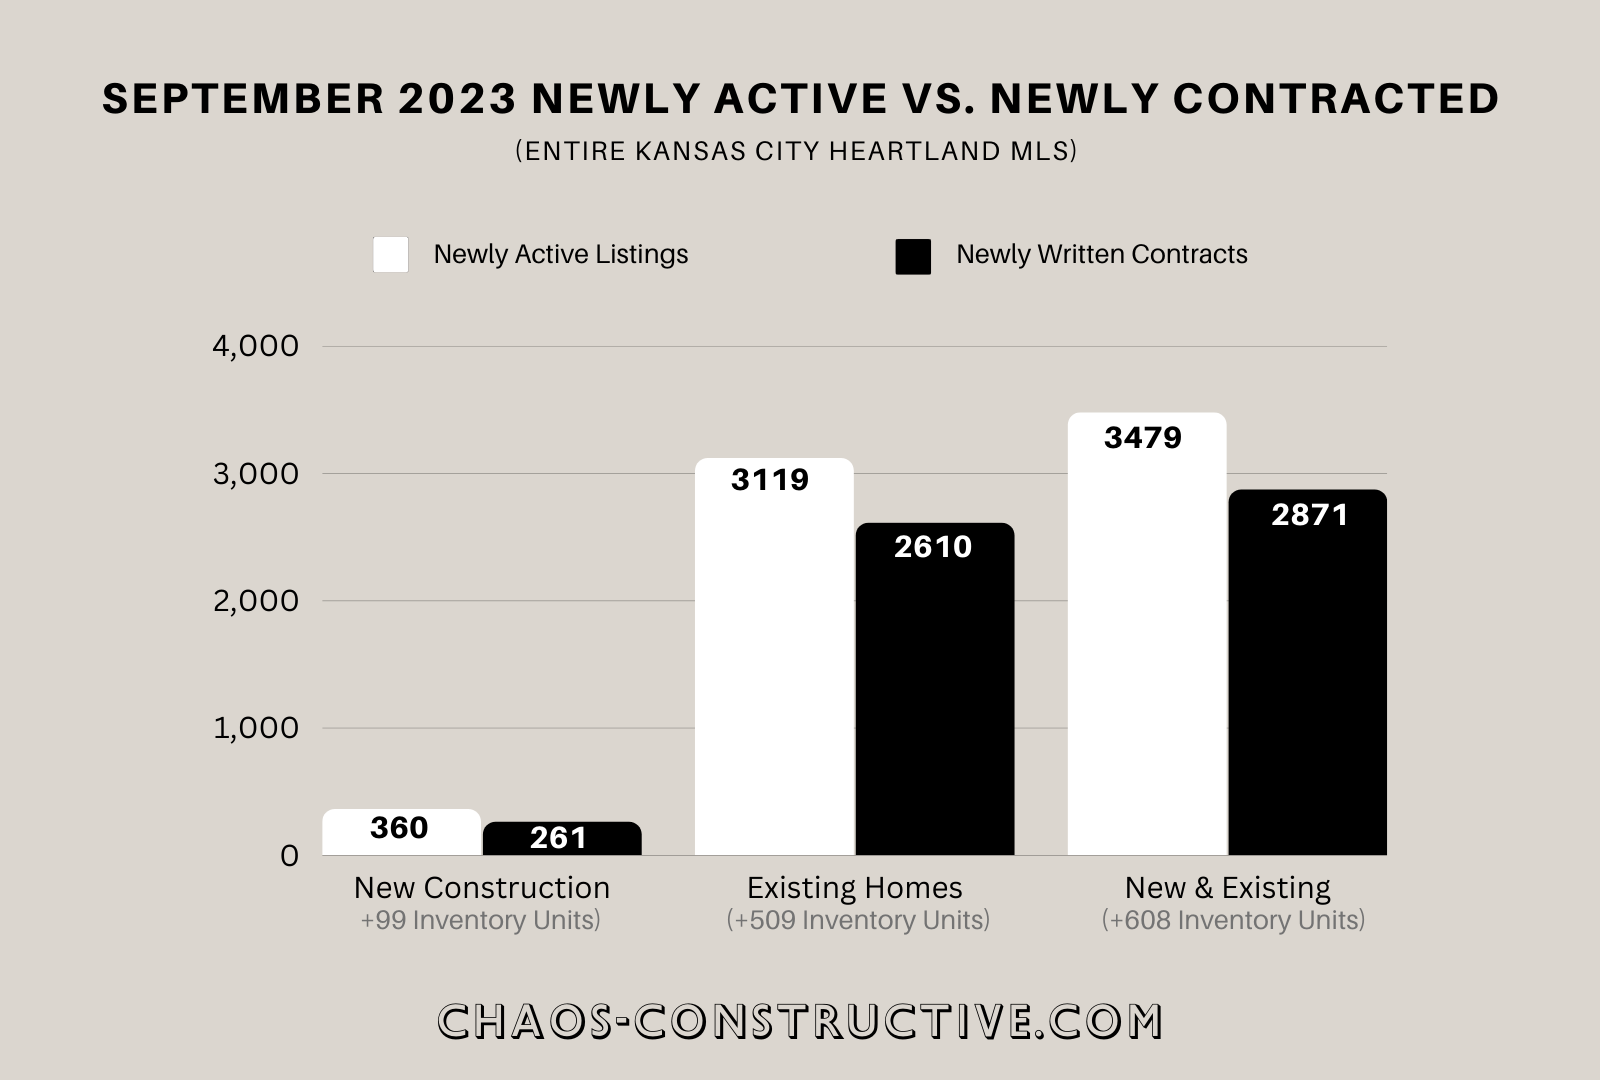
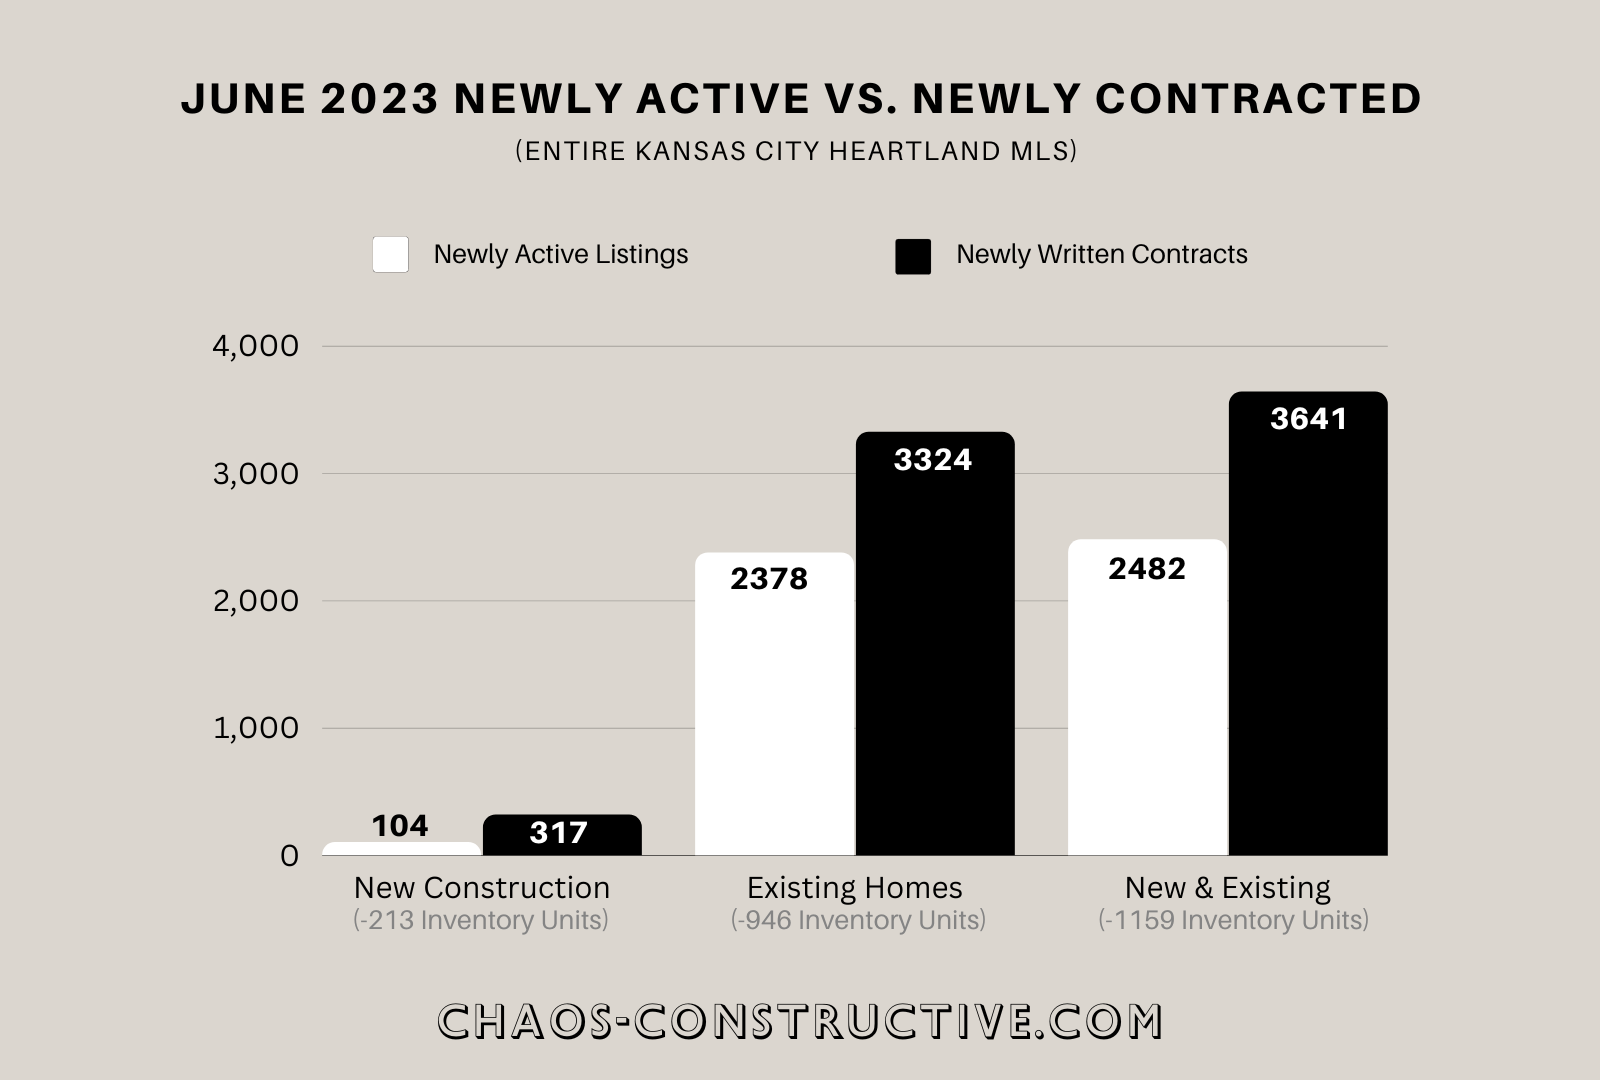
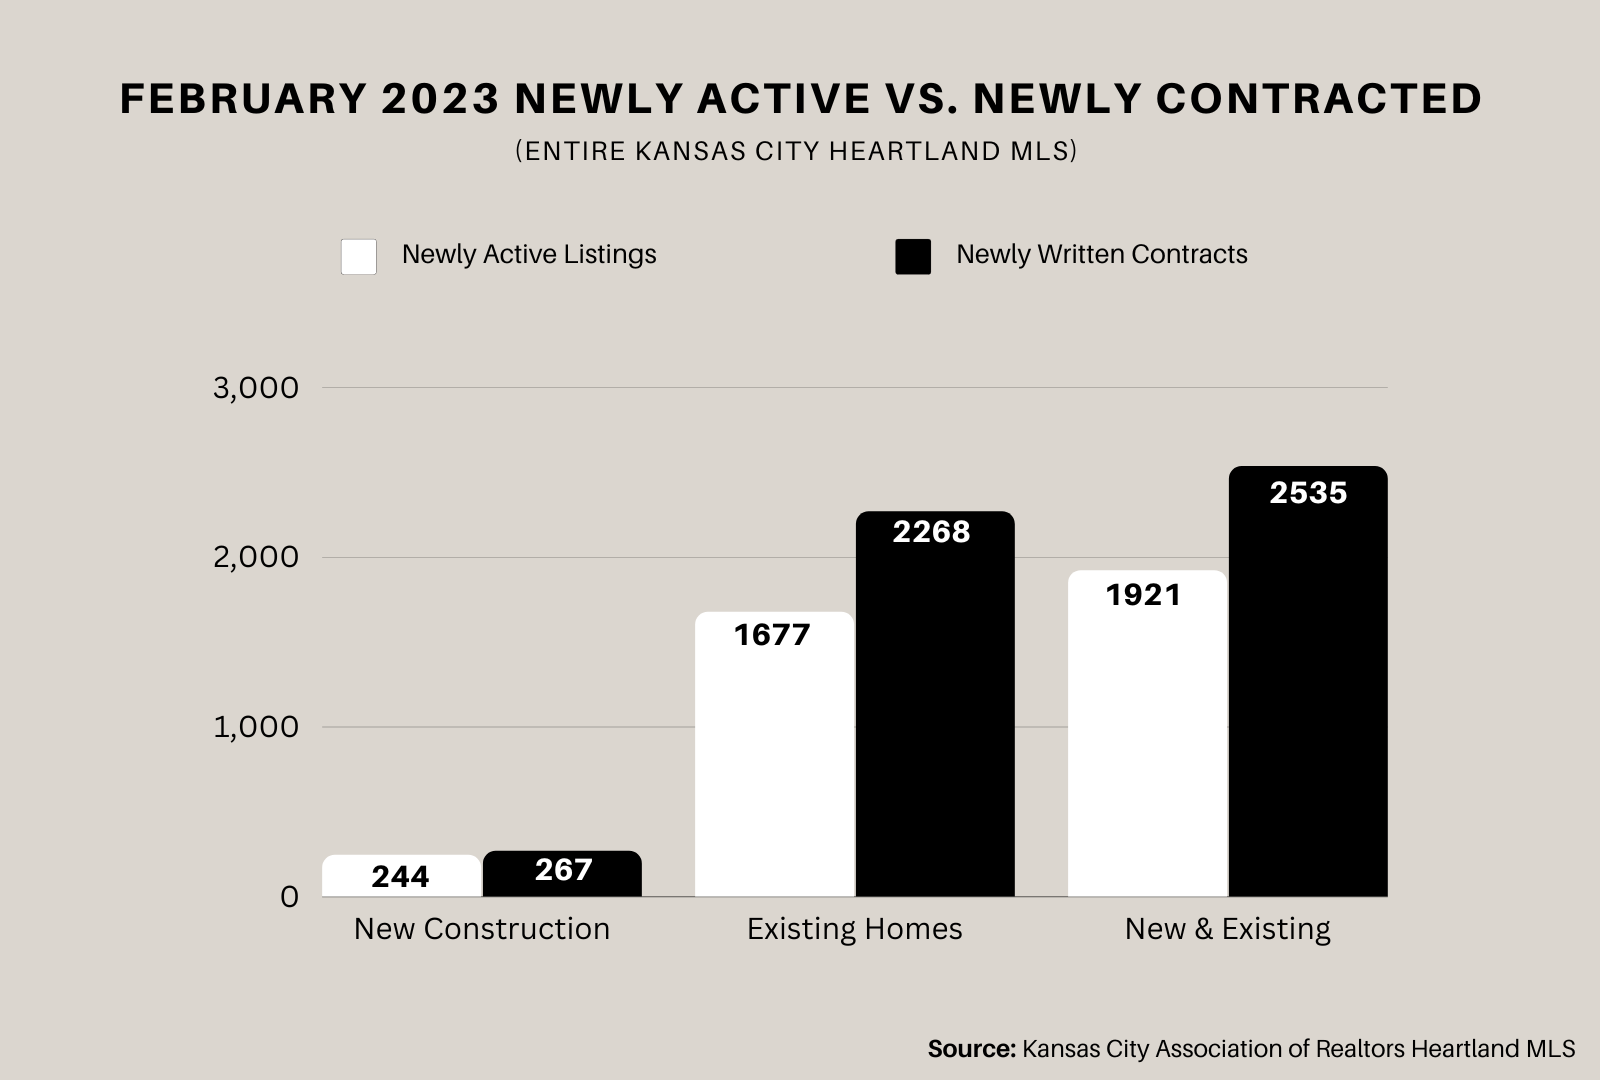
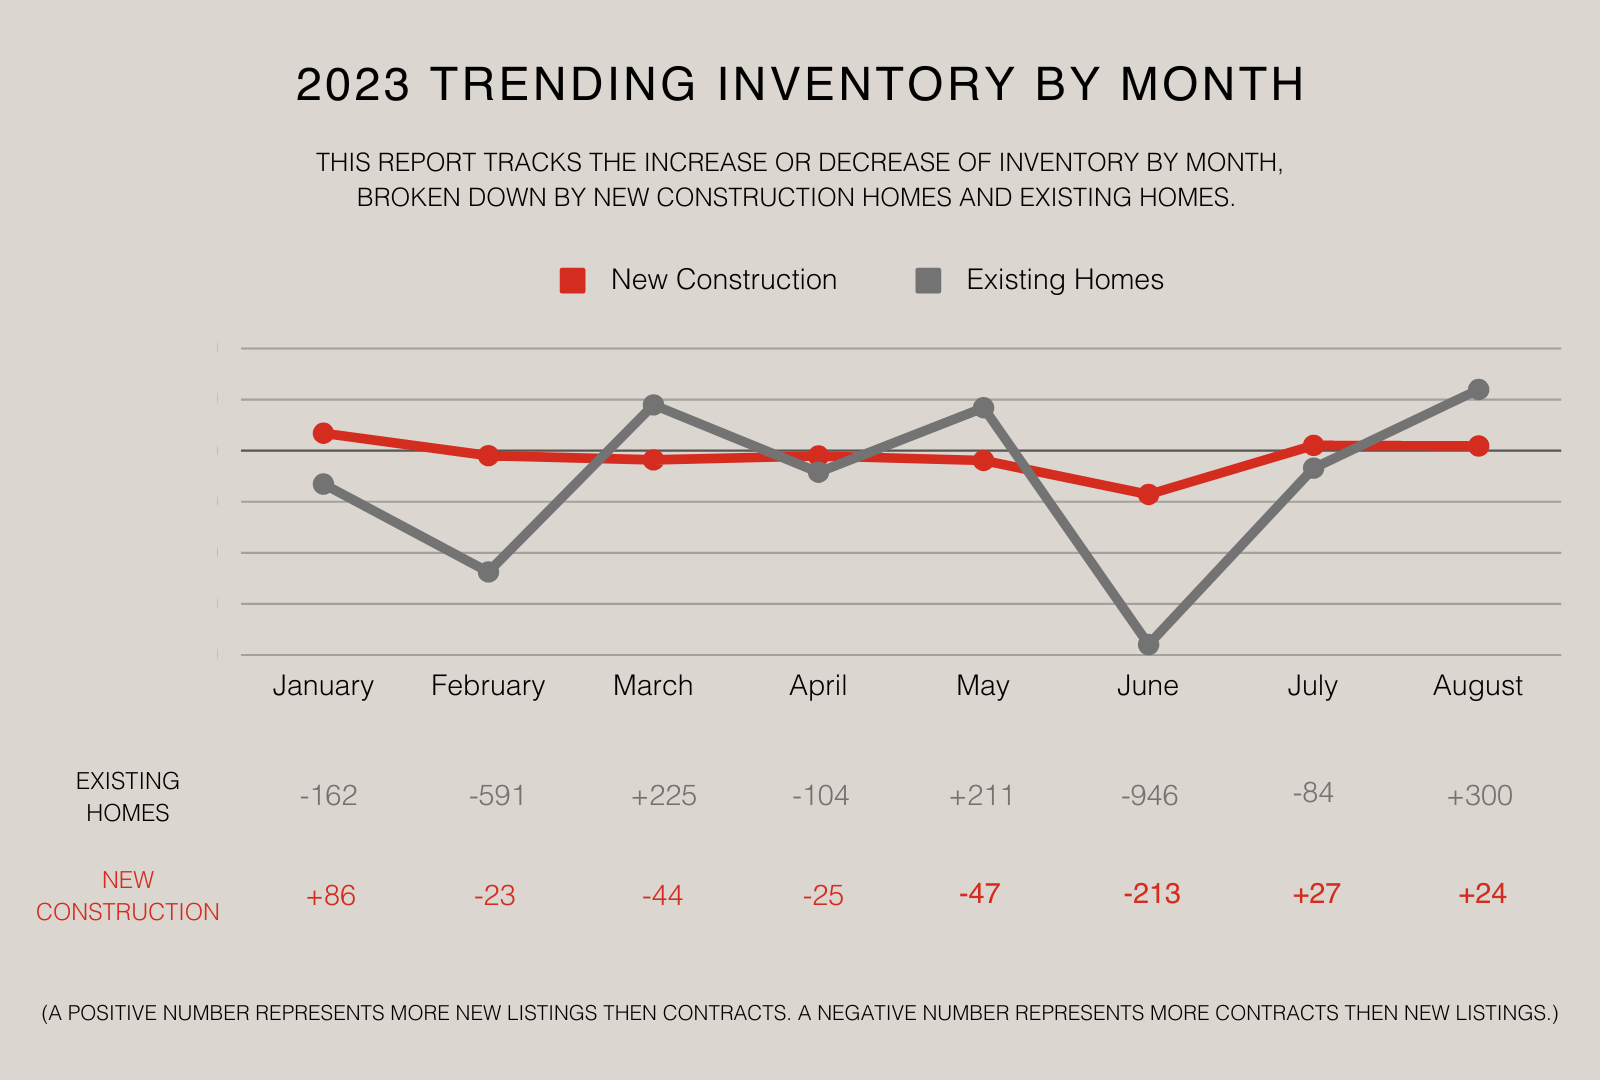
THIS REPORT TRACKS NEW INVENTORY AGAINST NEWLY CONTRACTED INVENTORY YEAR TO DATE FOR 2023.

